Energie AG Oberösterreich
Refurbishment planned on the digital twin instead of legacy drawings.
Read the success storyPortfolios need comparability. A consistent digital as-is model across every asset makes investment decisions robust and ESG evidence auditable.
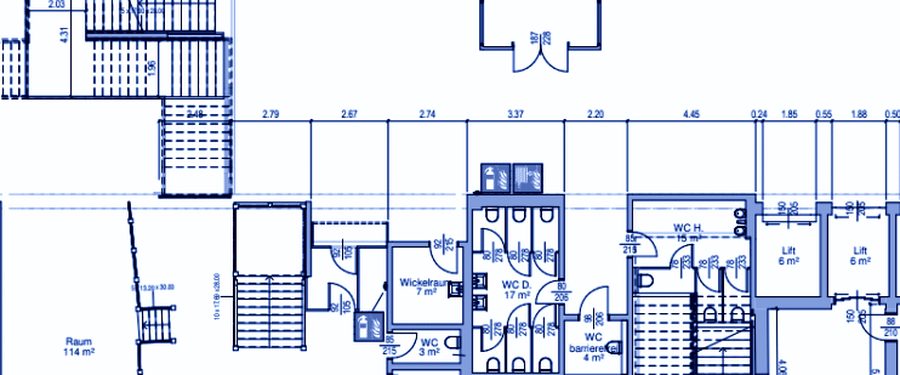
A portfolio of 60 assets has 60 data states. One building exists as a BIM model, thirty as PDF drawings, the rest as ring binders.
Every valuation restarts the research. Areas come from different standards, construction years from different sources, condition data from different years.
For ESG evidence that is no longer enough. Anyone who has to prove a renovation rate needs a basis that can be audited.
Every asset is captured the same way and structured the same way. Only then are metrics comparable between assets.
Area schedules to DIN 277 and ÖNORM B 1800, derived from the model and traceable back to the point cloud. Every figure has a source.
Envelope areas, glazing areas, component build-ups and asset inventory exist as data. That lets you calculate renovation needs instead of estimating them.
For an acquisition one capture day replaces several site visits. The condition is documented before the deadline runs.
DIN 277
area schedule per asset, derived from the model and verifiable against the point cloud.
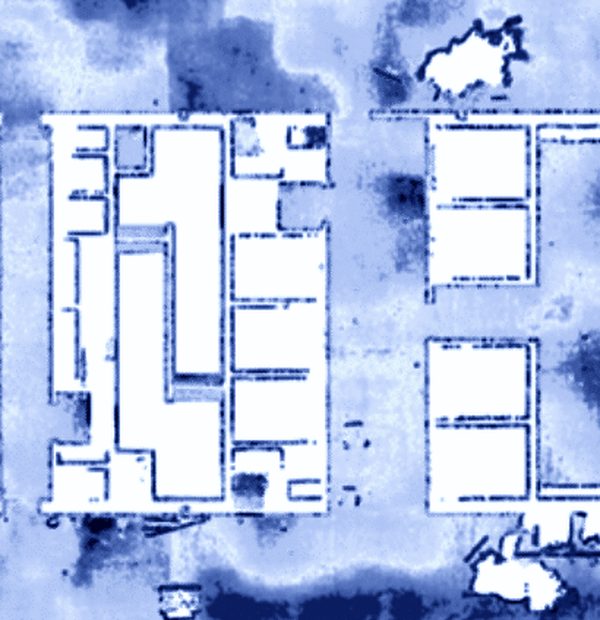
The facility manager dashboard consolidates the metrics of every asset: areas to DIN 277, asset inventory, compliance status. Continuously updated instead of delivered once.
Asset lifecycle intelligence builds on the same data basis. With an AI-ready foundation, portfolio questions can be answered without querying 60 assets one by one.
We no longer debate dimensions. We debate the design.
01
We capture one simple and one complex asset. That produces the capture template for the portfolio.
02
Assets with refurbishment, reletting or a planned sale go first. The rest follow in quiet periods.
03
The dashboard consolidates the assets. New assets enter the same system.
Yes. Every area is derived from the model, and the model is verified against the georeferenced point cloud. The verification report accompanies the area schedule.
Yes. We capture listed and hard-to-access areas without contact: laser scanning works with no intervention in the fabric.
An 8,000 m² office building is captured in one to two days. Point cloud and panoramas sit in the viewer after about a week, the BIM model after three to five weeks.
Tell us what you are working on. We show you what a reliable digital basis for your site looks like.