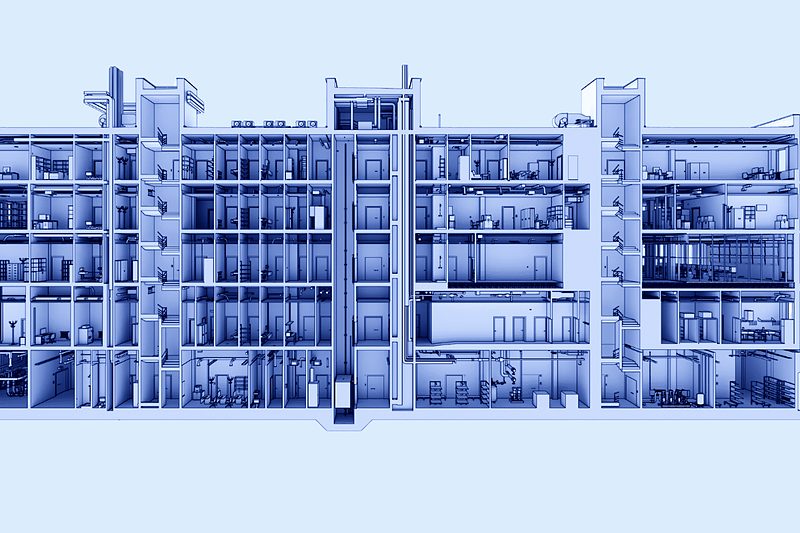
Evidence of progress. Not descriptions.
Controlling a build takes more than a site photo and a set of minutes. qapture captures the as-built condition at regular intervals and places it next to the design model — visible to everyone involved, in the same geometry.
The minutes say complete. The wall says otherwise.
Construction progress is still mostly described: a photo, a line in the minutes, a percentage. If anyone later disputes whether a trade was actually finished on the cut-off date, it is one account against another.
The same goes for workmanship. A deviation of a few centimetres often surfaces only once the next trade is standing in front of it — and by then it costs.
Capture at intervals, compare in the model.
This use case builds on the capture and structure stages, only repeated: the site is scanned at fixed intervals, each capture becomes a point cloud and can be laid against the design model and against the previous state. What deviates is visible before it is built in.
What it gives you.
Deviations surface early
As-designed and as-built sit in the same geometry. What does not fit shows up while it is still accessible.
Evidence that holds
Every cut-off date exists as a capture — traceable for client, designers and contractors alike.
Fewer site visits
Progress can be checked in the model instead of travelling out for every question.
What the comparison makes visible.
Eight findings from the capture that accompanied construction at the Bonn heart centre. Each image shows the recorded as-built condition and what the comparison against the design model made of it.
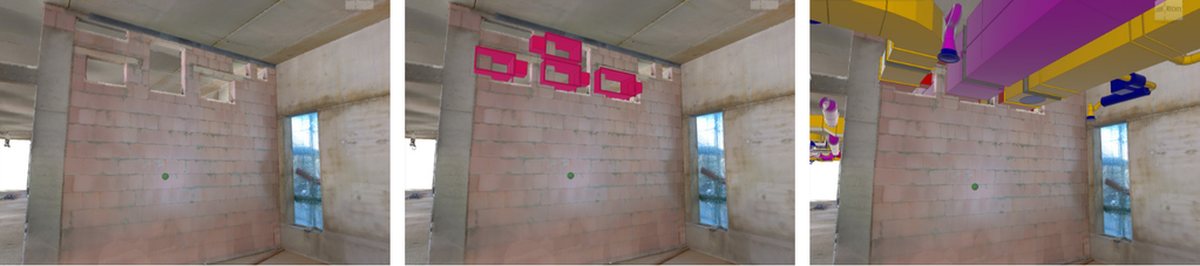
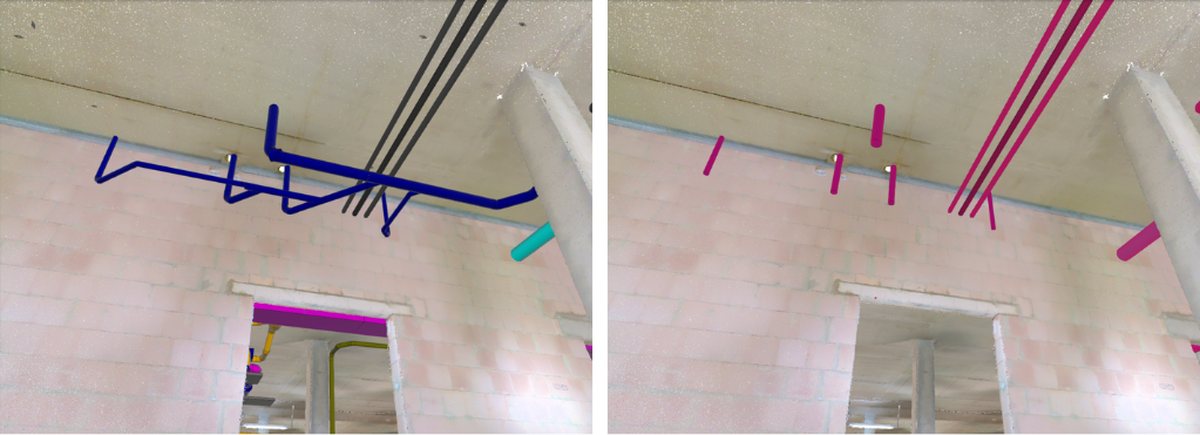

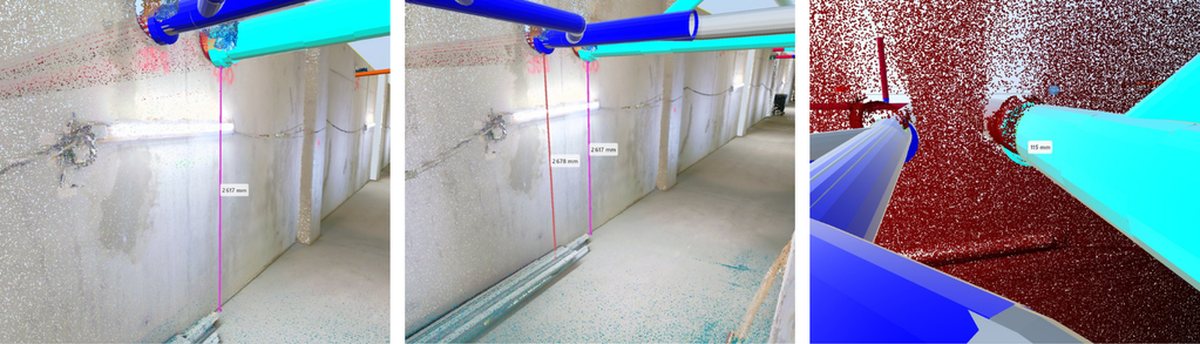
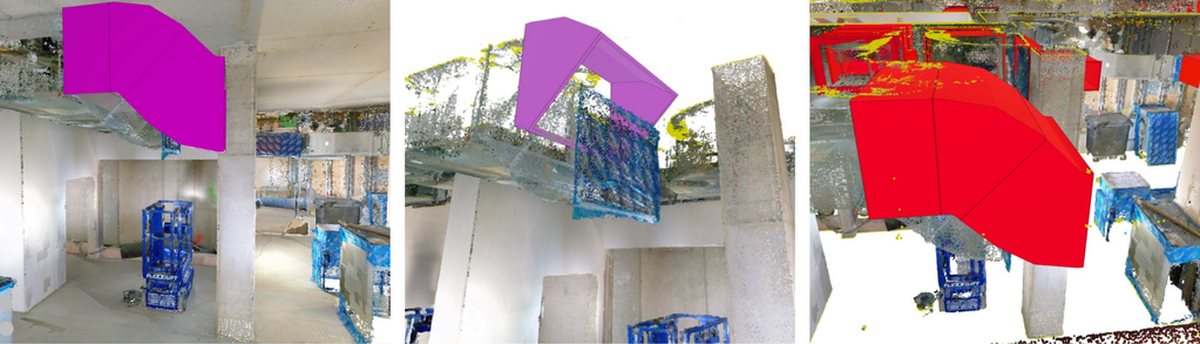
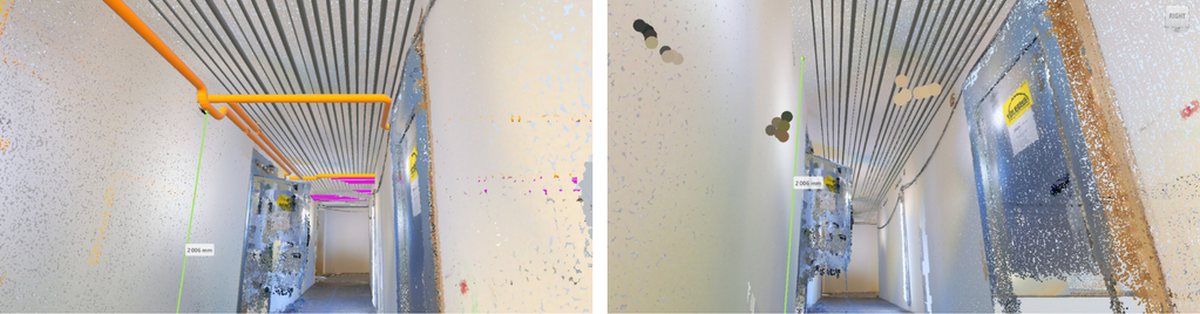
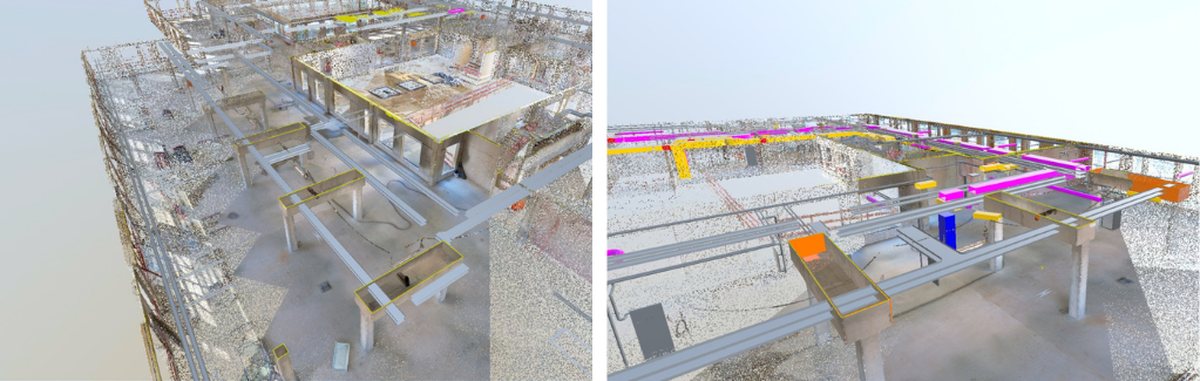
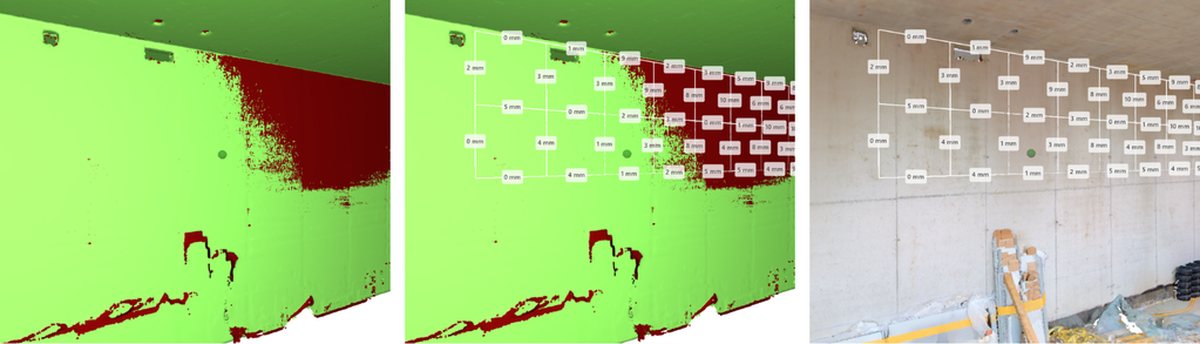
Bonn University Hospital.
The heart centre at Bonn University Hospital, 25,000 m² at a construction volume of EUR 250 million, captured as it was built. Comparing scan against design model documented more than 10,000 deviations and findings; physical site visits fell by 50 %.